You are at the beginning of your first iteration of the construction phase. Your biggest challenge is:
How can you break e.g. dashboard requirement up in a way that you can still work in an end to end manner?
What happened so far…
Remember my previous blog post? You were at the beginning of a new business intelligence (BI) or data project and decided to follow an incremental-iterative project approach. You didn’t had a clue about the detailed requirements and their implications on the solution architecture and data model. During a short inception phase (probably two weeks time) you gained many insights together with your newly assembled team. You worked on a rough release roadmap and the architectural corner stones of the future BI solution. Finally you presented the results of the inception phase and got the funding for the upcoming two phases of the release, namely the construction and transition phase.
Let’s assume you already have a minimal infrastructure in place which enables you to start working immediately (this infrastructure was already there before the project or, more likely, set up during the inception phase). You have a new source system to connect to, an empty data warehouse database as well as a dashboarding solution like Power BI at your fingertips.
Runnable & Tested Stories
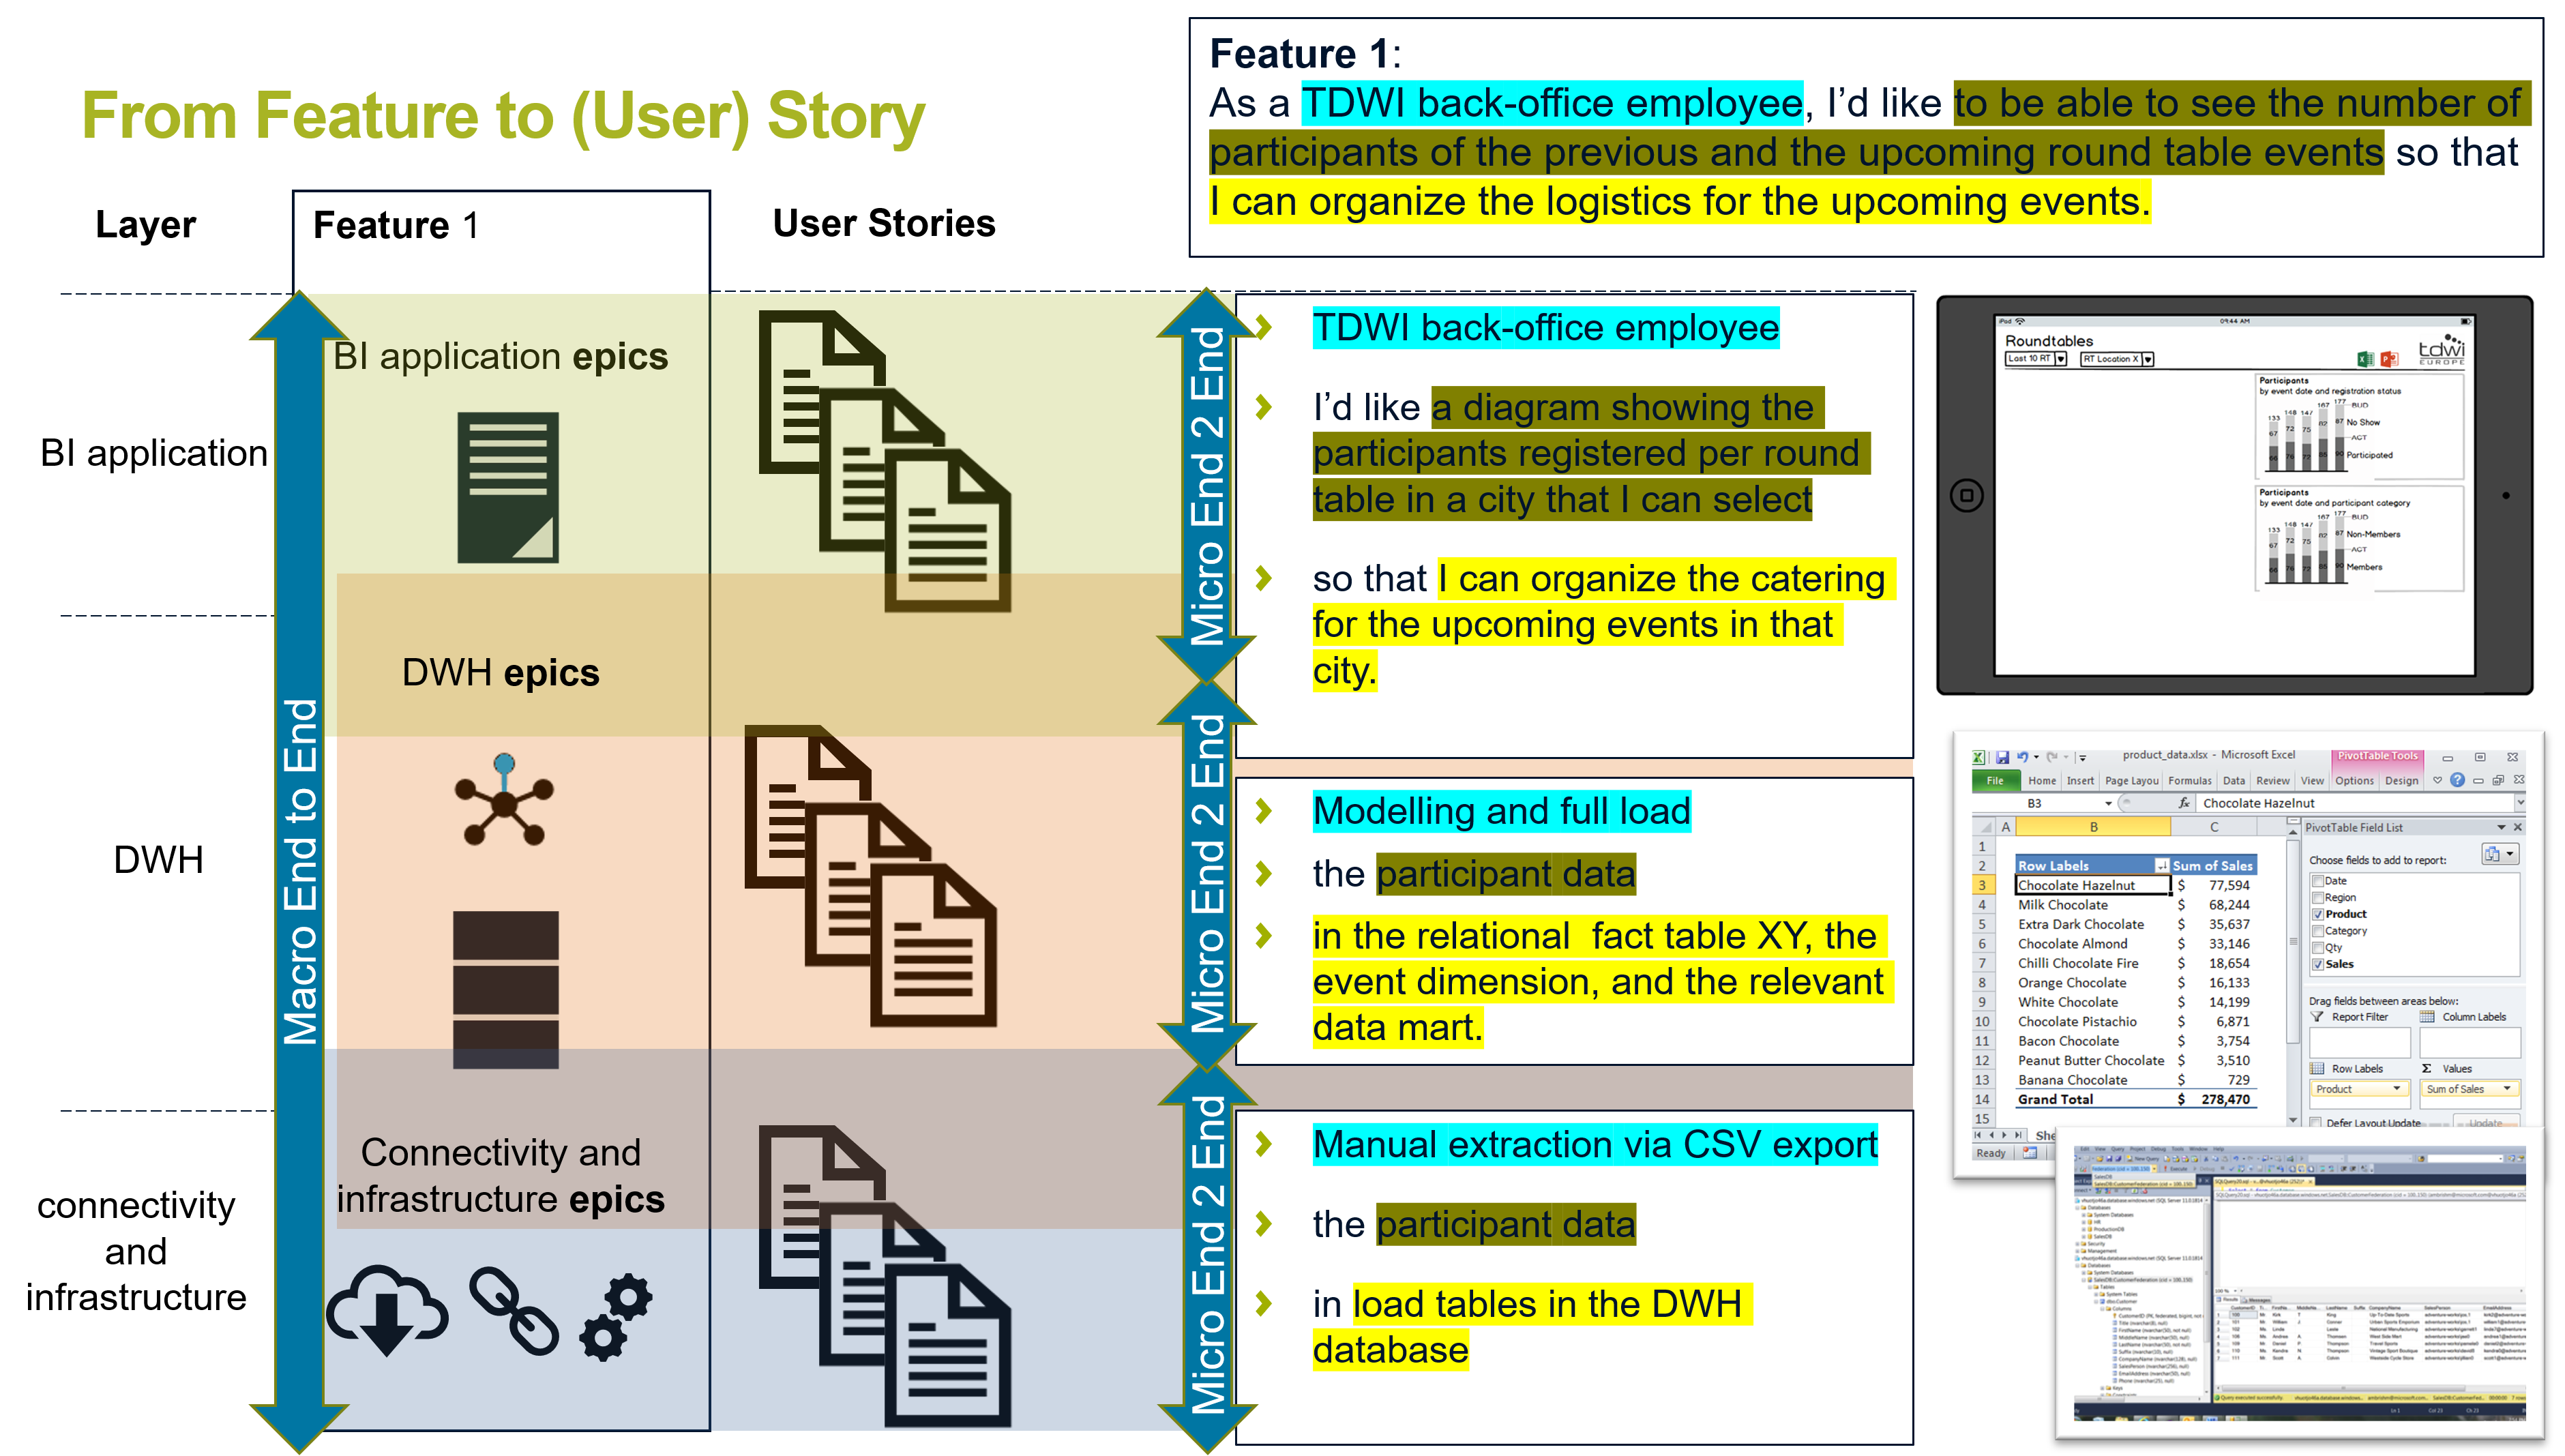
Luckily you had the chance to structure your backlog a little bit during the inception phase. Therefore you already have some backlog items in place to start with. You used the technique I described here to split your initial dashboard requirement into various pieces – in an agile jargon these pieces are called features, epics and stories. These elements are depicting a scope hierarchy (even though you might name the levels differently): A feature contains one to many epics and one epic contains one to many stories. Let’s have a look what I understand by a story first:
- The story is the smallest planning unit I use to plan a project respectively the iteration.
- The story covers a timespan limited to one or two working days.
- A story always has an end-to-end characteristic. In analytics, this often means that a story has a data source as its start and a form of data evaluation as its end.
When stories are implemented, they are „done“ once they are runnable (e.g. you can query some data) and tested (you verified that the query results are correct). You can also call this a Runnable & Tested Story (RTS).
Scope Breakdown
Stories can be found on all levels of the typically layered architecture of your future BI or data system: First of all, you need to establish a minimal connectivity to your source data. Second, you will have to model your data in some way and – depending on the chosen technology, load the the data from the source sytem to the BI system. Based on this intermediate step you want to visualize the data as a report or dashboard.
In some situations you can work on this macro end to end view in just two days and provide an RTS as a result. If you have this kind of stories, these are good candidates for showing quick success in your project and therefore earn trust from your stakeholders. But often, things are more complicated. Then it makes sense to break things up:
The top level in your scope hierarchy (in the picture below this would be feature 1) provides you with a macro end to end view. Ideally you manage to complete a feature within a single iteration. At the beginning of your first iteration you might want to choose such a feature and think about which stories are necessary to complete an initial version. What does „initial version“ mean? It means you should see data as soon as possible. Try to keep things simple first: Maybe you don’t even need a real connectivity to your source system but only use a CSV export as your first RTS. On the data warehouse level just start with a full load as the first RTS (and add an incremental load as a future story). Finally add a simple visualisation, e.g. a simple table or chart as your first RTS on top of it.
Don’t forget testing!
Remember: Even though this is yet a simplified version of the final „product“ you want to build, don’t forget to make it runnable and test the results you are exposing. If you can only connect to some test data, still make sure you can define and fullfil some acceptance criteria to verify completness, correctness etc. Check for these criterias by showing data on all architectural levels (as indicated on right side of the above illustration) throughout the development process. You shouldn’t wait with testing until BI application layer is implemented!
You are still at the beginning of your first iteration. But your backlog is now clearly structured into a first few features, epics and stories. As the stories are small enough to be completed in one or two days, the work is „tangible“ for you and your team and you are excited to start implementing. Have fun!